[ad_1]
Released: 2023-09-01
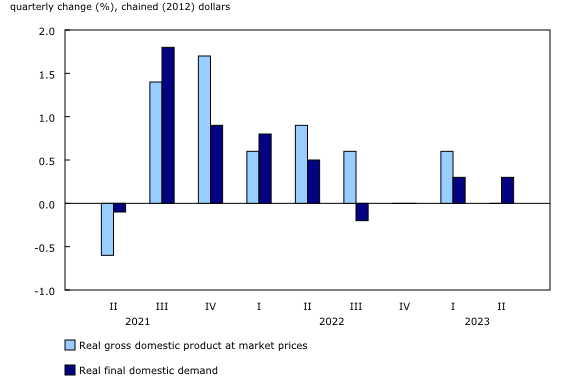
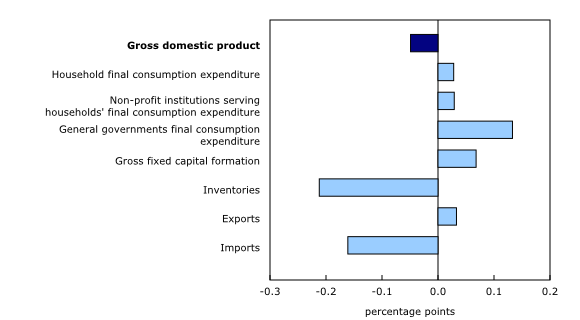
Real gross domestic product (GDP) was nearly unchanged in the second quarter, following a 0.6% rise in the first quarter. The slowdown was attributable to continued declines in housing investment, smaller inventory accumulation, as well as slower international exports and household spending. Increased business investment in engineering structures and higher government spending were among the few components that contributed to growth. Final domestic demand rose by 0.3%, a similar increase to that seen in the first quarter of 2022.
Chart 1

Real gross domestic product and final domestic demand

Chart 2

Contributions to percentage change in real gross domestic product, second quarter of 2023

Housing investment continues to decline
Housing investment fell 2.1% in the second quarter, the fifth consecutive quarterly decrease. The decline was led by a sharp drop in new construction (-8.2%), which was observed in every province and territory except for Nova Scotia. Renovation activities (-4.3%) also fell. These declines coincided with higher borrowing costs and lower demand for mortgage funds, as the Bank of Canada continued their monetary tightening, raising the policy interest rate to 4.75% in the second quarter.
Despite higher borrowing costs, ownership transfer costs (+18.2%), which represent resale activity, posted the first increase since the fourth quarter of 2021.
Chart 3

Housing investment

Inventories accumulate at slower pace
Lower inventory accumulations in the second quarter compared with the previous quarter applied downward pressure on GDP growth, resulting in the smallest buildup in the stock of inventories since the fourth quarter of 2021. In the second quarter of 2023, the economy-wide stock-to-sales ratio reached its highest level since the second quarter of 2020.
While non-farm inventory accumulation was relatively widespread in the second quarter of 2023, both manufacturing and wholesale trade recorded the most significant slowdowns in accumulation. Meanwhile, retail trade recorded an accumulation, primarily fuelled by expanded inventories of motor vehicles.
Increase in imports larger than exports
Imports of goods and services rose 0.5% in the second quarter, following a 0.2% increase in the first quarter. Imports of unwrought gold, silver and platinum group metals and their alloys, passenger cars and light trucks and aircraft led this increase.
Exports of goods and services edged up 0.1% in the second quarter, following a 2.5% increase in the first quarter. Increases in intermediate metal products and commercial services were offset by declines in exports of crude oil and bitumen, wheat and canola.
Household spending slows
Growth in real household spending slowed to 0.1% in the second quarter from 1.2% in the first quarter. The slight increase in spending on goods (+0.1%) in the second quarter was led by higher spending on new trucks, vans and sport utility vehicles (+3.3%), reflecting improvements in previous supply chain challenges. Growth was moderated, however, by declines in new passenger cars (-9.5%), furniture and furnishings (-3.3%), major durables for outdoor recreation (-8.3%) and natural gas (-6.4%).
Household spending on services was unchanged in the second quarter, following a 1.1% rise in the first quarter. In the second quarter, sharp declines in spending by Canadians abroad (-6.3%) and expenditures on alcoholic beverage services (-5.9%) offset the rise in spending on shelter services (+0.5%), air transport (+6.8%) and telecommunication services (+1.9%).
While aggregate household expenditures edged up in the second quarter, spending per capita fell 0.7%. In fact, per capita household spending declined in three of the last four quarters.
Chart 4

Household sector, selected components, seasonally adjusted, annual rates

Real business investment edges up after four consecutive quarterly declines
Business investment in non-residential structures rose 2.4% in the second quarter, led by increased spending on engineering structures (+3.3%), which rose for the 11th consecutive quarter. Business spending on machinery and equipment rose 2.7% in the second quarter, following a 0.1% increase in the first quarter. The increase was led by stronger spending on aircraft and other transportation equipment, coinciding with a significant growth in imports of ships and aircraft.
Gross domestic product implicit prices rise, while terms of trade declines
The GDP deflator rose 0.7% in the second quarter, as consumer inflation remained elevated. However, the terms of trade—the ratio of the price of exports to the price of imports—fell 2.0% in the second quarter, primarily because of a 3.4% decline in prices of exported goods. This was the fourth straight quarterly decrease in the terms of trade.
Chart 5

Gross domestic product price indexes, selected components

The real gross national income edged down 0.2% in the second quarter, reflecting the lower terms of trade.
Compensation of employees rises
Compensation of employees rose 2.2% in the second quarter, following a 1.9% increase in the previous quarter. Increases in compensation of employees was mainly due to higher average wages. Additionally, there were two large retroactive payments in the quarter, one for health care in Ontario and the other for the military. Together, these retroactive payments added 0.3 percentage points to the overall growth of employee compensation.
The total wages and salaries paid in the goods-producing industries rose 2.3% in the second quarter, while those in the services-producing industries grew by 2.2%. The major contributors to wage growth were professional and personal services (+2.1%), health care and social assistance (+3.5%) and wholesale and retail trade (+1.9%).
Total wages and salaries in federal government public administration grew 2.4% mainly because of a large retroactive payment to Canadian Armed Forces members. This increase was recorded despite the strike action embarked upon by some federal employees represented by the Public Service Alliance of Canada in April and May.
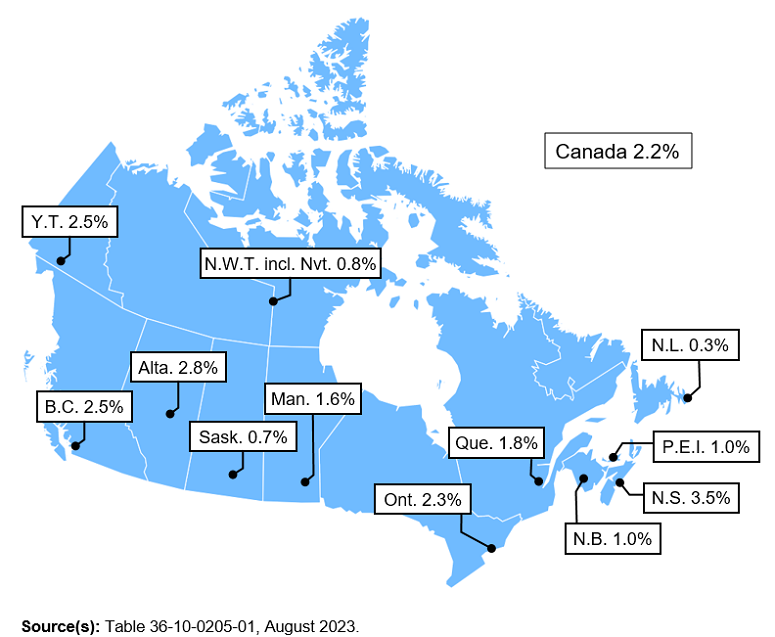
Map 1

Compensation of employees, quarter-to-quarter % change, seasonally adjusted data

Compensation of employees increased in all of the provinces and territories in the second quarter. Growth was highest in Nova Scotia (+3.5%) and Alberta (+2.8%), followed by British Columbia (+2.5%) and Yukon (+2.5%). Growth was lowest in Newfoundland and Labrador (+0.3%).
Household saving rate increases on higher labour income and investment earnings
Household disposable income increased by 2.6% in the second quarter, a reversal from the decline in the previous quarter (-0.6%). Most of the growth in disposable income was due to gains in compensation of employees (+2.2%) and non-farm self-employment income (+3.1%), each of which grew at the fastest pace since the first quarter of 2022.
In contrast with previous quarters, net property income increased in the second quarter of 2023, as gains in interest on deposits (+19.0%) and corporate dividends (+3.8%) more than compensated for higher interest payments on mortgage debt (+5.8%) and consumer credit (+6.9%). However, this was the first occasion since the beginning of 2022 that household non-mortgage and mortgage interest expenses grew at a rate that was less than 10%.
While growth in disposable income accelerated in the second quarter of 2023, consumption expenditures rose at one of the slowest paces in the last two years (+1.0%), in nominal terms. As a result, the household saving rate climbed to 5.1% in the second quarter from 3.7% in the first quarter. The household saving rate is aggregated across all income brackets; in general, saving rates are greater for households in higher income brackets. With the upcoming release of the Distributions of Household Economic Accounts for the second quarter of 2023 on October 4, household incomes, consumption, saving and wealth will be available by household income quintile and age groupings.
Corporate incomes face continued headwinds
In the second quarter, non-financial corporate incomes declined for the fourth consecutive quarter, continuing a trend that began in the third quarter of 2022, after reaching historically high levels in 2022. Incomes generated by energy-related industries continued to decline in the second quarter of 2023 partly because of scheduled maintenance that impacted operations. As well, a continued decline in energy prices (-6.0%) and in the volume of energy exports (-2.5%) also put downward pressure on the incomes of energy-related industries.
Financial corporations posted a 0.6% decline in operating surplus in the second quarter; this was the seventh quarter in which operating surplus contracted. This decline was partially the result of a continued narrowing of the net interest earned by chartered banks on their loans and deposits, which are used in the estimation of the financial intermediations services they provide. However, the net interest on other items such as debt securities recorded notable growth over the last few quarters.
Sustainable development goals
On January 1, 2016, the world officially began implementing the 2030 Agenda for Sustainable Development—the United Nations’ transformative plan of action that addresses urgent global challenges over the following 15 years. The plan is based on 17 specific sustainable development goals.
Data on gross domestic product, income and expenditure are an example of how Statistics Canada supports the reporting on global sustainable development goals. This release will be used to measure the following goals:


Note to readers
With this release, data have been updated for the first quarter of 2023 due to the incorporation of updated source data and seasonal adjustment.
Accounting for e-commerce transactions with non-resident vendors
The indicators used to estimate Household Final Consumption Expenditure have been adjusted to account for non-resident e-commerce sales. The Monthly Retail Trade Survey collects data only on resident vendor e-commerce sales. The non-resident vendor e-commerce adjustment, which is applied to the indicators to estimate household consumption, mainly the Retail Commodity Survey, is a non-seasonally adjusted, quarterly value. This adjustment has been in place since the fourth quarter of 2019. For the second quarter of 2023, the adjustment represents $763.6 million, applied to the household consumption indicators. The adjustment is derived using sources such as details from customs transactions, goods and services tax, remittances and financial statements for certain enterprises.
Re-referencing of the volume and price estimates
Volume and price estimates for the quarterly gross domestic product (GDP) and accompanying set of accounts will be updated to 2017 (2017=100) reference year with the third quarter 2023 release in November 2023. Additionally, at that time, the international trade classification will be updated to the North American Product Classification System (NAPCS) 2022. Given the inclusion of a more recent NAPCS and reference year, price baskets will also be updated.
This re-referencing exercise will be coordinated with re-referencing activities of other volume measures within the Canadian Macroeconomic Accounts, such as the Canadian International Merchandise Trade and the Stock and Consumption of Fixed Capital Program.
The provincial and territorial economic accounts for 2022, to be released on November 8, 2023, will also be on a 2017 reference year (2017=100) basis for price and volume estimates.
General
Percentage changes for expenditure-based statistics (such as household spending, investment and exports) are calculated from volume measures that are adjusted for price variations. Percentage changes for income-based statistics (such as compensation of employees and operating surplus) are calculated from nominal values; that is, they are not adjusted for price variations. Unless otherwise stated, growth rates represent the percentage change in the series from one quarter to the next: for instance, from the first quarter of 2023 to the second quarter of 2023.
For information on seasonal adjustment, see Seasonally adjusted data – Frequently asked questions
Real-time tables
Real-time tables 36-10-0430-01 and 36-10-0431-01 will be updated on September 11.
Next release
Data on GDP by income and expenditure for the third quarter will be released on November 30.
Products
The data visualization product “Gross Domestic Product by Income and Expenditure: Interactive tool,” which is part of the Statistics Canada – Data Visualization Products series (71-607-X), is now available.
The document, “Recording new COVID measures in the national accounts,” which is part of Latest Developments in the Canadian Economic Accounts (13-605-X), is available.
The data visualization product “Overview of the stock and consumption of fixed capital program: Interactive tool,” which is part of Statistics Canada – Data Visualization Products (71-607-X), is now available.
The Economic accounts statistics portal, accessible from the Subjects module of the Statistics Canada website, features an up-to-date portrait of national and provincial economies and their structure.
The User Guide: Canadian System of Macroeconomic Accounts (13-606-G) is available.
The Methodological Guide: Canadian System of Macroeconomic Accounts (13-607-X) is available.
Contact information
For more information, or to enquire about the concepts, methods or data quality of this release, contact us (toll-free 1-800-263-1136; 514-283-8300; infostats@statcan.gc.ca) or Media Relations (statcan.mediahotline-ligneinfomedias.statcan@statcan.gc.ca).
[ad_2]
Source link


