[ad_1]
Final data for 2021 indicates that the EU spent €331 billion on research & development (R&D), up 6.9% compared with the previous year (almost €310 billion). Compared with 2011, there was a 45.0% increase. These rates of change are in current prices, meaning they reflect both price changes and real changes in the level of expenditure.
When looking at R&D intensity, i.e. R&D expenditure as a percentage of GDP, data show a slight decrease from 2.30% in 2020 to 2.27% in 2021. This could be explained by the GDP rebound in 2021 after the significant drop in 2020 due to the impact of the COVID-19 pandemic. Compared with 2019, before the pandemic, R&D intensity increased by 0.05 percentage points (pp) (2.23%), while compared with the previous 10 years, it increased by 0.26 pp.
R&D is a major driver of innovation, and R&D expenditure and intensity are two of the key indicators used to monitor resources devoted to science and technology worldwide.
This information comes from final data on R&D expenditure published by Eurostat today. The article presents a handful of findings from the more detailed Statistics Explained article.

Source dataset: rd_e_gerdtot and OECD
Among the EU countries, the highest R&D intensity in 2021 was recorded in Belgium (3.43%), Sweden (3.40%), Austria (3.26%) and Germany (3.13%), all with expenditures above 3% of their GDP. In contrast, six EU countries reported R&D expenditure below 1% of their GDP in 2021: Romania (0.47%), Malta (0.65%), Latvia (0.74%), Bulgaria (0.77%), Cyprus (0.83%) and Slovakia (0.92%).
Only seven EU countries registered a decrease in their R&D intensity between 2011 and 2021: Finland (-0.63 pp), Estonia (-0.55 pp), Ireland (-0.44 pp), Luxembourg (-0.38 pp), Slovenia (-0.29 pp), Denmark (-0.18 pp) and Malta (-0.01 pp).
While most of the EU countries spent more of their GDP in R&D in that time reference, the highest increase was in Belgium, +1.26 pp, followed by Greece (+0.77 pp) and Poland (+0.68 pp).
Although it has increased, the EU’s R&D expenditure relative to GDP continues to be below the corresponding ratios recorded in South Korea (4.93%), the United States (3.46%), Japan (3.34%) and China (except Hong Kong) (2.41%, 2020 data). Between 2011 and 2021, South Korea’s R&D intensity increased by 1.34 pp, more than any of the other 4 economies.
Business sector: biggest spender in R&D
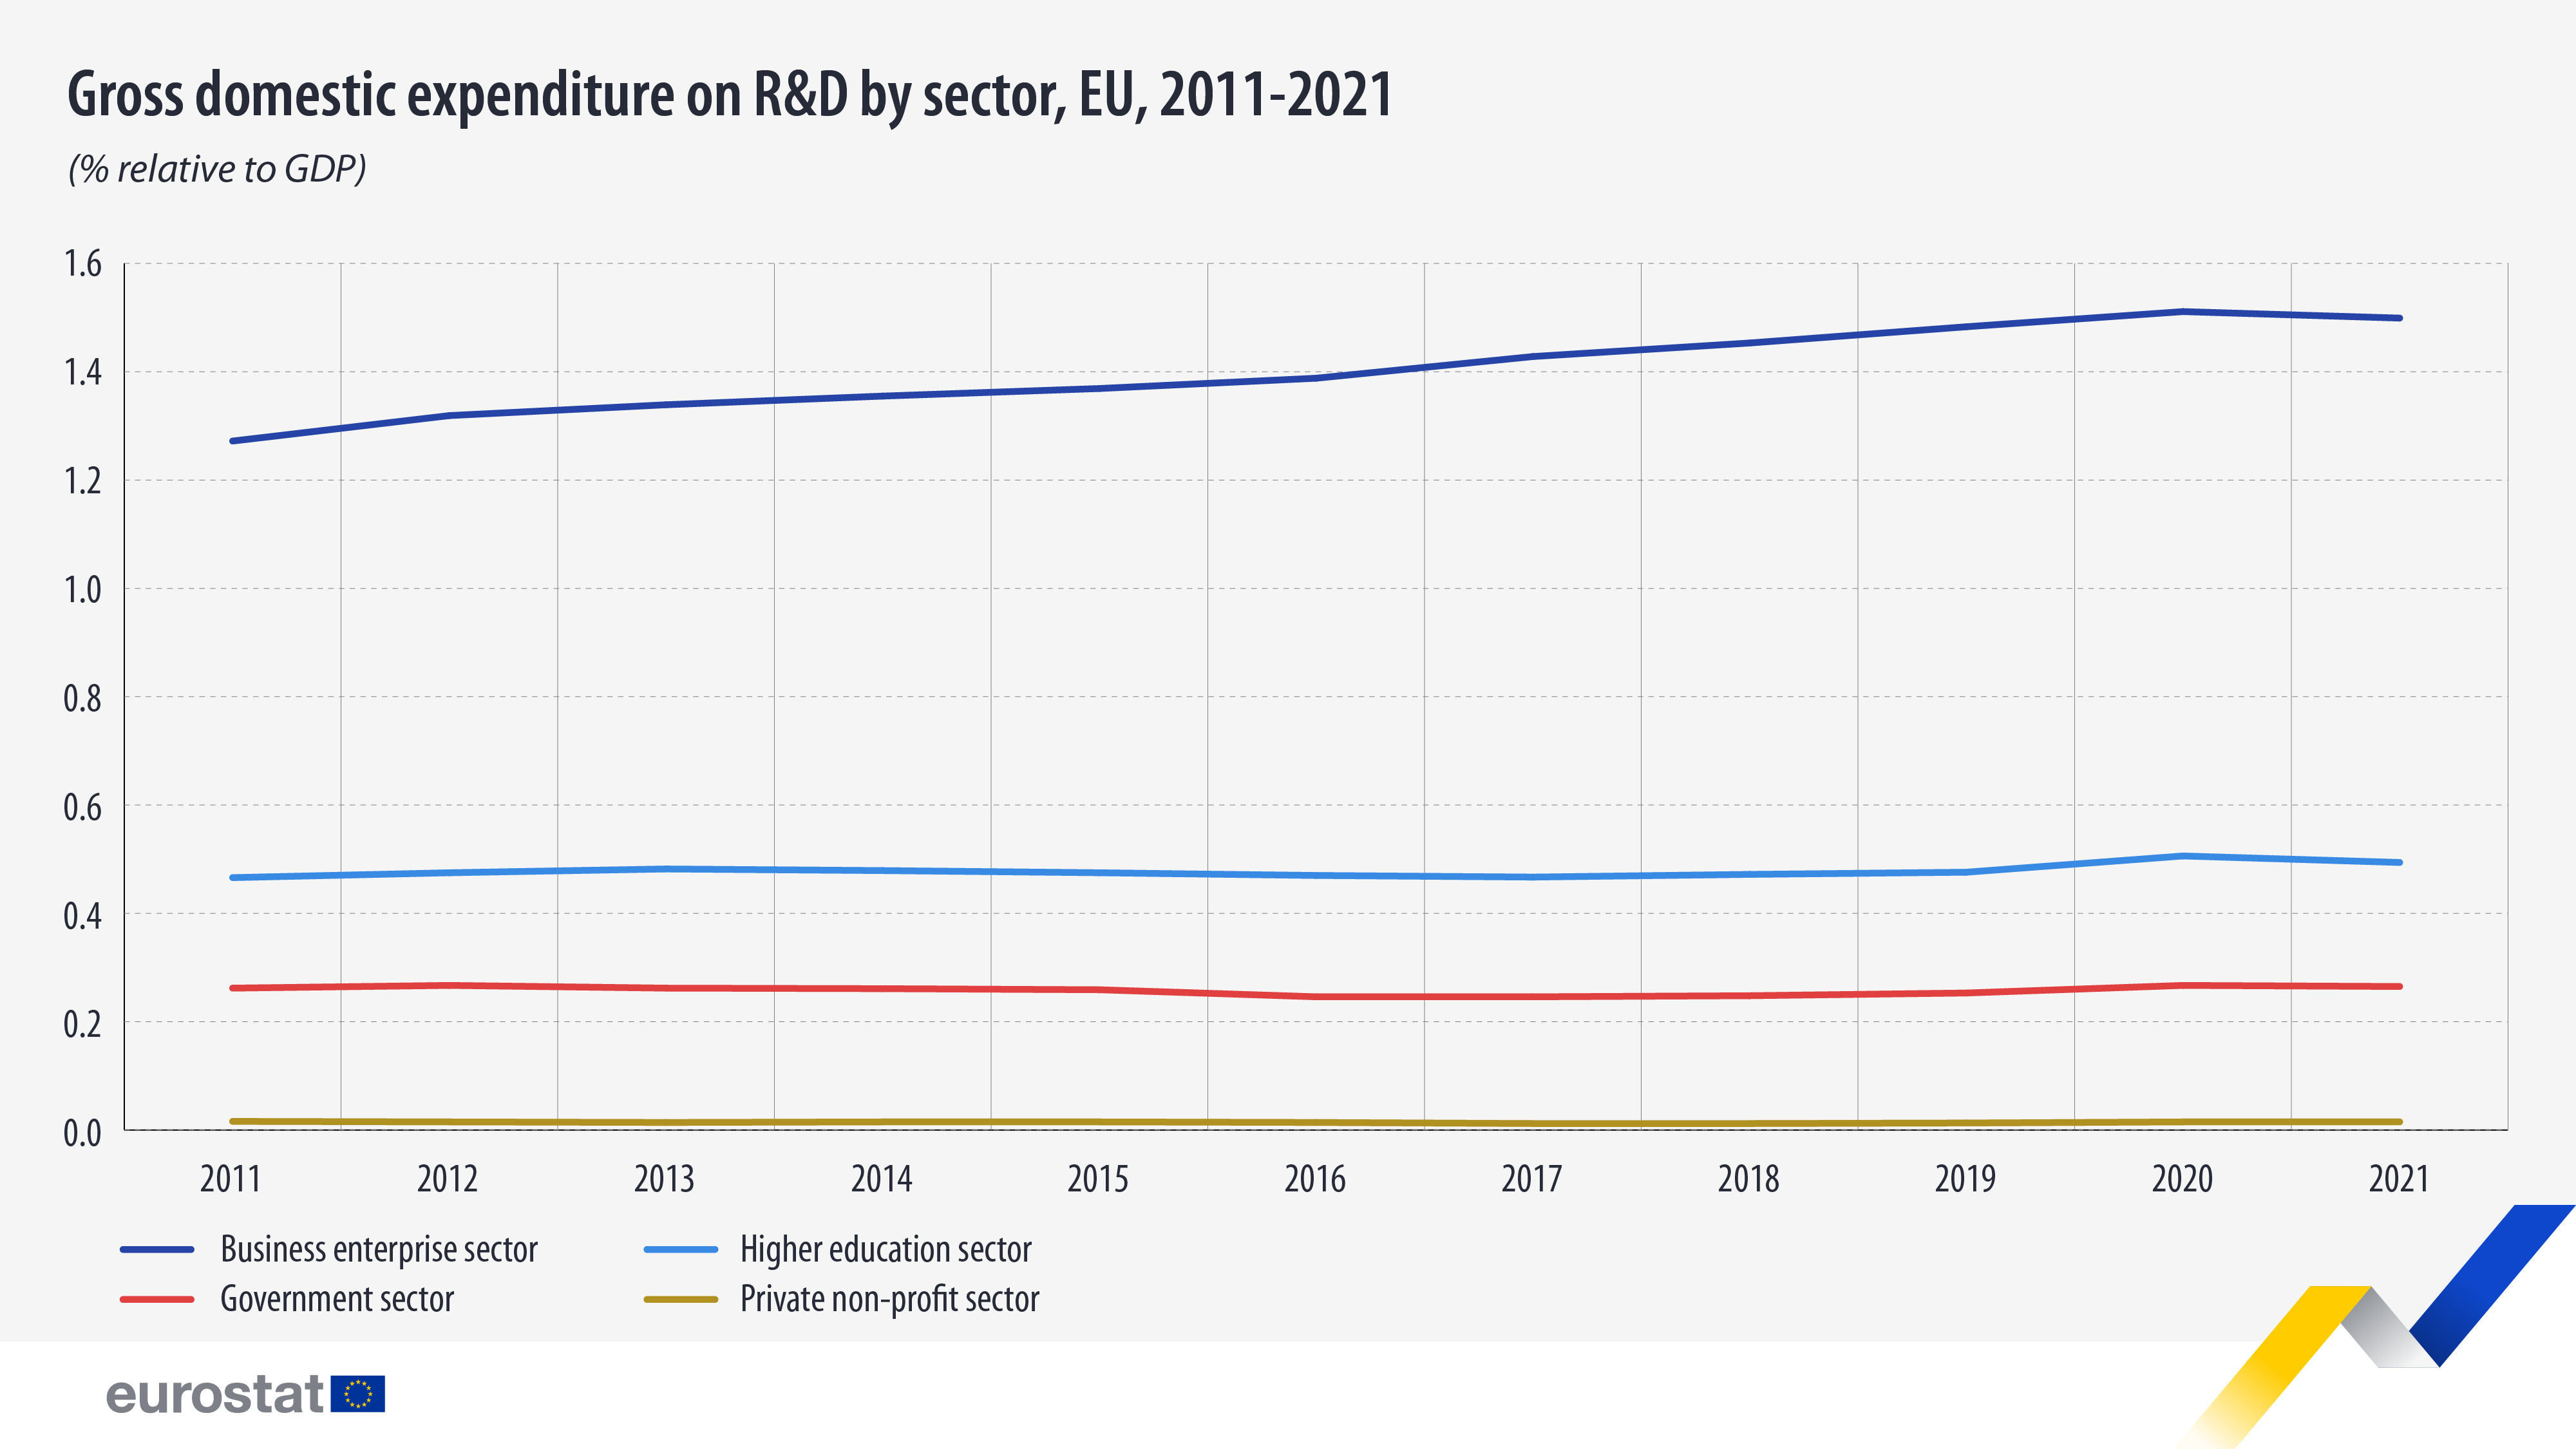
In terms of R&D expenditure by sector in the EU, the business enterprise sector has since 2000, when data started to be available, accounted for the largest share of the R&D expenditure. In 2021, the business sector represented 65.95% of total R&D disbursed in that year, the equivalent of €218.32 billion, followed by the higher education sector (21.76%; €72.03 billion), the government sector (11.64%; €38.55 billion) and the private non-profit sector (0.65%; €2.14 billion).
As a percentage of the GDP, the business sector R&D expenditure represented 1.50%, the higher education sector represented 0.49%, the government sector 0.27% and the private non-profit sector 0.02%. Between 2011 and 2021, the business sector intensity rose the most, by 0.23 pp.

Source dataset: rd_e_gerdtot and OECD
[ad_2]
Source link
